
The Network Engineering Tools Model is an interactive architectural reference — a broker-based framework recognizing network data as a Big Data application. Click below to view the full interactive card.
Category: Networking
Requiem for a Tool Architecture/Methodology
Magic Beans:
It’s like we’re Jack in Jack and the Beanstalk chasing magic beans. We buy technology thinking it’s going to solve our problems. We get some beans, like them for a while, then go onto chasing more beans. The problem is us: what are we trying to do. –g. joseph
This information is based on a large financial global corporation with a large number of network tooling technologies.
The purpose of this section is to present aspects of the collection of network engineering tools in an effort to develop a tool architecture and model.
Contents
- Current Tools in Relation to Protocol Layer
- Future Tools in Relation to Protocol Layer
- Future Tools in Relation to Logical Model
- Requiem for a Tool Architecture
- The Network Engineering Tools Model (company undisclosed)
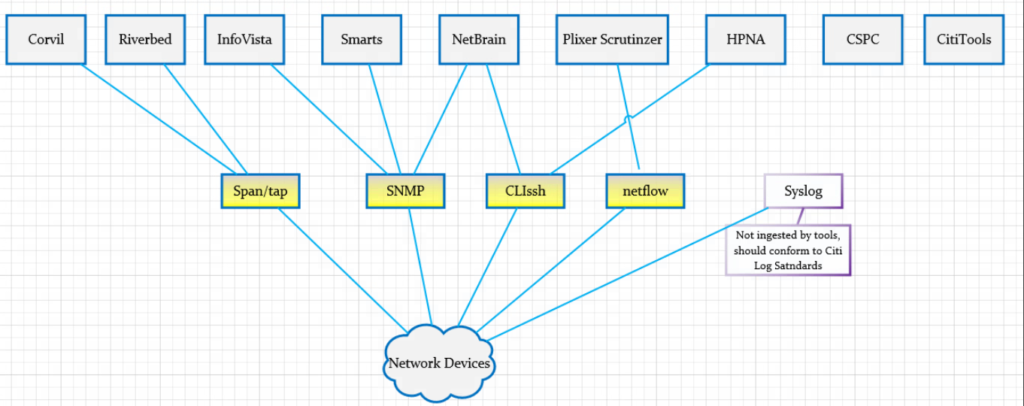
Current Tools in Relation to Protocol Layer
The following diagram shows an overview of the current tools along with protocols (i.e. SNMP; we stretch the definition beyond typical OSI layering). This relationship helps with the simple perspective of “what goes with this” and “what goes with that”. Simple but important questions can be raised such as: “Why are there multiple tools are using SNMP.”
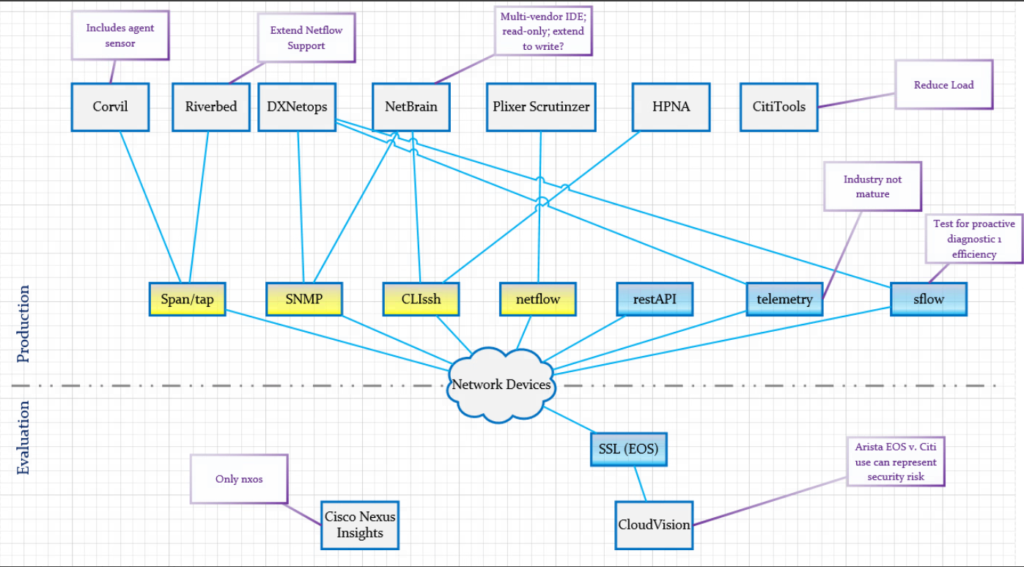
Future Tools in Relation to Protocol Layer
The following diagram extends the previous diagram to include future tools the company was considering. The blue-components of the protocol layer show new protocol-tool relationships.
Requiem for a Tool Architecture
The following diagram represents a Tool Architecture with a big-data feel. The intention is to produce responsive data at scale and off-load the burden of production information from the tools. The numbers appearing in red are indices in the table below the diagram.
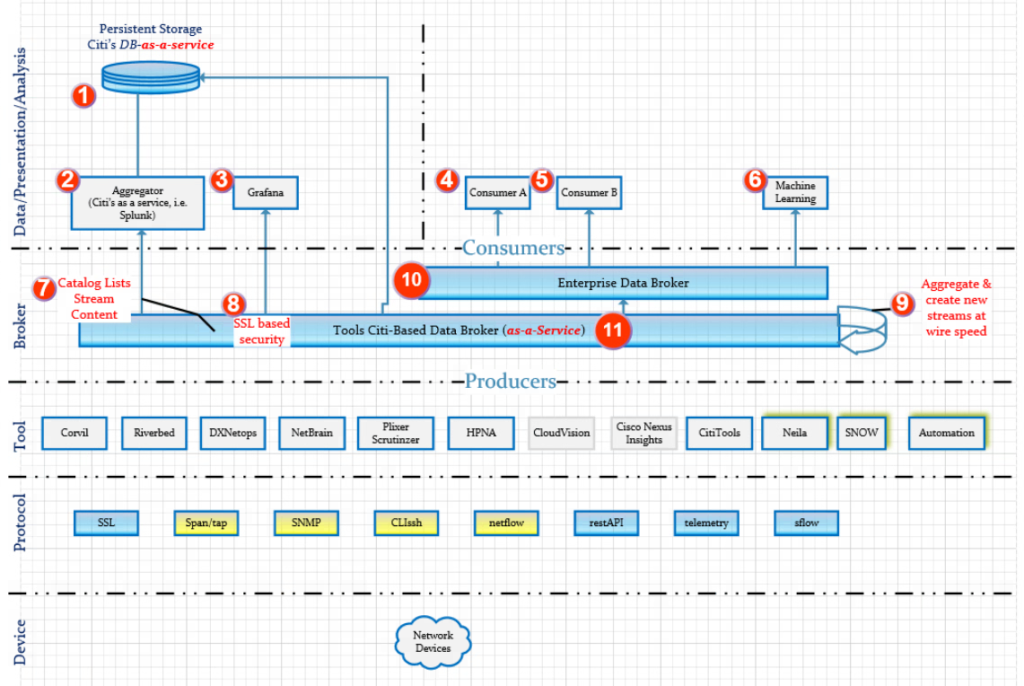
| Index | Explanation |
| 1 | Persistent storage for tools if required. MongoDB preferably offered as SAS (software-as-a-service) is a likely candidate. |
| 2 | Aggregatory for the purpose of converting ephemeral data to long term data requirements. Splunk is a likely candidate as a first choice with Elastic Search coming in second (due to no official Kafka support for an elastic search connector). |
| 3 | Grafana due to user demand. It is not a first choice to support an enterprise scale because of the lack of official support for a Kafka connector. It does ingest data from Elastic Search |
| 4 | Consumer A is a general consumer attached to the Enterprise-Data-Broker. |
| 5 | Consumer B is a general consumer attached to the Enterprise-Data-Broker. |
| 6 | Machine learning should naturally be a consumer of the Enterprise-Data-Broker in order to correlate different data streams as desired. A correlation coefficient could also be computed to measure the relatedness of the streams to each other. |
| 7 | A catalog mechanism of the various data streams to provide a library of the different data streams. |
| 8 | SSL-based security. Consumers and produces would have to have the correct CN for access. |
| 9 | Desired: The aggregator that lives with-in the data broker (i.e. Kafka streams) to combine streams for efficient at optimum speed and produce. This removes the burden of latency of consumers ingesting multiple streams. |
| 10 | Enterprise Data Broker (i.e. Kafka). Not controlled by Tools Staff. Consumes data from the Tools Data Broker |
| 11 | Tools Data Broker |
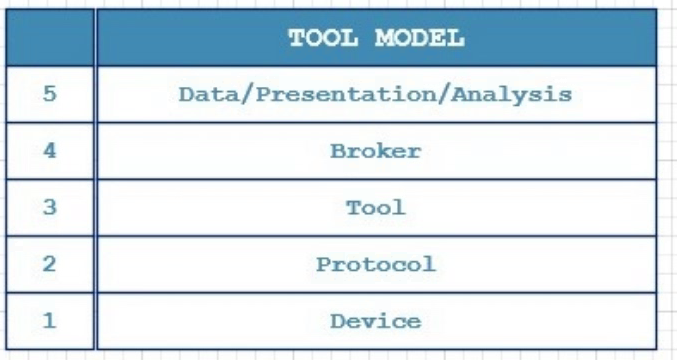
The Network Engineering Tools Model
The following diagram is a natural conclusion from the previous sections. It is similar to the concept found in the 4-Layer TCP or 7-Lay OSI models. It should serve as the starting point of “what we are trying to do” at a high level as opposed to starting “somewhere in the middle” with a magic bean (new tool).
Example Unix and Windows/Powershell Network Socket Table Commands
October 7th, 2016 | Garland Joseph
What tcp sockets are open?
Unix
netstat -an | egrep -I “^tcp.*LISTEN”
netstat -an | egrep -I “^tcp.*LISTEN” | awk ‘{split($4,a,”:”);print a[2]}’
Powershell
netstat -an | select-string listemAuto-Discovery with NMAP
June 26th, 2017 | Garland Joseph
I created this script in order to use it as a feed for enterprise management tools such as Nagios. It’s a bit difficult to get a handle on auto-discovery tools within an enterprise management tool when it discovers what can be an overwhelming number of hosts. NMAP is smart enough to translate the MAC address into a vendor if it can.
This script called discover uses the NMAP tool on Linux (tested on Centos).
#! /bin/bash
#
# Name: discover
#
# Garland Joseph, garland.joseph@gmail.com
# Date: June 2017
#
# Auto-discover on subnet using nmap, can be fed into something like nagios
# as a seed file after proper formatting.
#
# ----

if [[ -z ${1} ]]
then
cat <<EOD
$0 <subnet>
where
subnet, by example, is something like 192.168.1.0/24
EOD
exit
fi

nmap -sn ${1} | awk '
BEGIN{ printf("%-16s| %-18s| %-35s| %-30s\n","IP","MAC","NAME","VENDOR") }
/^Nmap scan report/ {
NAME=$5
x=$NF
gsub("[()]","",x)
IP=x
}

/^MAC Address/ {
MAC=$3
split($0,a,"(")
split(a[2],b,")")
VENDOR=b[1]
printf("%-16s| %-18s| %-35s| %-30s\n",IP,MAC,NAME,VENDOR)
}'

Here is an example of the output
[root@localhost ~]# ./discover 192.168.1.0/24
IP            | MAC               | NAME                               | VENDOR
192.168.1.1   | C8:D7:19:DE:54:2E | NyaRaePrimary                      | Cisco Consumer Products
192.168.1.100 | B8:27:EB:72:2A:4A | kodi1.grandenetworks.net           | Raspberry Pi Foundation
192.168.1.101 | 00:1F:3B:75:7F:EB | 192.168.1.101                      | Intel Corporate
192.168.1.102 | 6C:3B:E5:76:96:A5 | HP-Printer.grandenetworks.net      | Hewlett Packard
192.168.1.105 | A8:47:4A:AC:8F:89 | 192.168.1.105                      | Unknown
192.168.1.106 | F0:7D:68:0A:7C:8A | OllieMaeJoseph.grandenetworks.net  | D-Link
192.168.1.107 | 58:82:A8:81:C3:A6 | XboxOne                            | Unknown
192.168.1.109 | 28:56:5A:39:ED:FD | BRW28565A39EDFD.grandenetworks.net | Unknown
192.168.1.110 | 64:20:0C:90:24:D9 | Garlands-iPad.grandenetworks.net   | Apple
192.168.1.112 | 7C:D1:C3:17:0C:58 | Apple-TV.grandenetworks.net        | Apple
192.168.1.115 | B8:27:EB:12:DA:AC | kodi2.grandenetworks.net           | Raspberry Pi Foundation
192.168.1.118 | A4:77:33:8E:CE:C2 | Chromecast.grandenetworks.net      | Google
192.168.1.119 | 6C:AD:F8:5D:3A:D6 | 192.168.1.119                      | Azurewave Technologies
192.168.1.131 | F0:7D:68:0A:7A:D5 | EmmaEdwards.grandenetworks.net     | D-Link
192.168.1.135 | 28:10:7B:0C:3A:71 | EarlEdwards.grandenetworks.net     | D-Link International
192.168.1.136 | 00:09:B0:D6:A8:2A | 192.168.1.136                      | Onkyo
192.168.1.138 | 28:10:7B:0C:3A:74 | LeeJoseph.grandenetworks.net       | D-Link International
192.168.1.145 | D4:3D:7E:EF:93:99 | obama                              | Micro-Star Int'l Co
192.168.1.147 | E4:3E:D7:44:21:8F | LGwebOSTV.grandenetworks.net | UnknownSynchronized Windows to Windows Packet Capture
June 13th, 2017 | Garland Joseph
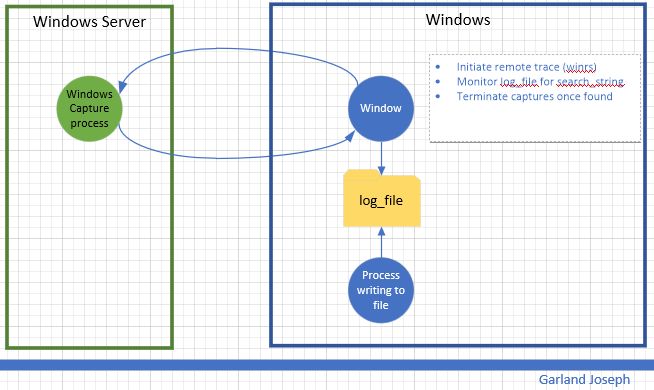
This script is part of a series of scripts that perform packet capture between two endpoints. In this case, the endpoints are two windows machines. This script was tested with the “source endpoint” as a Windows 10 machine and the “target endpoint” a Windows 2016 Server machine. The circular traces are started on each machine and stopped whenever an event is detected. In this case the event is to monitor a file for a particular string.
Requirements: Wireshark installed on Windows
Caveats: Target endpoint must be Windows Server (Source endpoint can be windows client).
Scenario
Script
<#
################################################################################################
.SYNOPSIS
Author: Garland R.Joseph, garland.joseph@gmail.com, July 2016
Simple Packet capture from windows to windows based on monitoring a file.
.DESCRIPTION
Side-effects
Uses an interim x.x and local_trace.ps1 file, but removes them at end.
.EXAMPLE
w2wcap [ -verbose | -v ] [ -c "capture-file" ] [ -s "seconds" ] [ -u "remote user" ] [ -p "password" ]
-r "remote host" -l "log file" -t "text string" -a "local interface" -b "remote interface"
.PARAMETER v | verbose
Optional. This option prints additional informational messages during processing.
.PARAMETER c
Optional. This option specifies the name of the capture file. The default is set to capture. The script is set to only create 2 files per endpoint and the default size is 512 MB. So the 2 files total will be less than a 1 GB. You can modify this behavior by changing the FILESIZE and FILECOUNT variables below. The filenames will look similar to...
capture_00049_20170612214134
capture_00050_20170612215042
.PARAMETER s
Optional. Range is 1 second to 18000 seconds (5 hours) for parsing the log file. The default is 5 seconds. Please examine the process to gauge impact on system resources. The lower the number, the more system resources are consumed.
.PARAMETER u
Optional. This is the username for the remote user on the target endpoint. You can hard code the value in the script (see the $u=Wireshark line below) or optionally specify the name on the command line. The account should have
sufficient privilege to run the tshark command tool for the Wireshark facility. This parameter is optional, but recommended so you don't store the username in a file.
.PARAMETER p
Optional. This is the password for the remote user. This parameter is optional, but recommended so you don't store the password in a file.
.PARAMETER r
Required. This is the hostname or ip address of the target endpoint.
.PARAMETER l
Required. This is the log file that will be parsed for the string as specified by parameter t. The traces will stop once a new string specified by parameter t is found in the log file. The script parses for an initial count so the log file does not have to be "zeroed-out".
.PARAMETER t
Required. This the text string used in parsing the log file.
.PARAMETER a
Required. This is the ip address of the local interface on the source
endpoint that "talks" to the target endpoint.
.PARAMETER b
Required. This is the ip address of the remote interface on the target
endpoint.
###############################################################################################
#>
#
# Setup Command Line Options
#
[CmdletBinding()]
Param (
[string]$c = "capture",
[ValidateRange(1,18000)]
[int]$s = 5,
[string]$u = "Wireshark",
[string]$p = "Pr1nceH1ll",
[Parameter(Mandatory=$True)]
[string]$r,
[Parameter(Mandatory=$True)]
[string]$l,
[Parameter(Mandatory=$True)]
[string]$t,
[Parameter(Mandatory=$True)]
[int]$a,
[Parameter(Mandatory=$False)]
[int]$b
)
If (-Not (Test-Path $l ) ) {
Write-Host "Log file $l does not exist"
exit
}
#
# Default options, can be changed to increase capture file size, count, etc
#
#$FILESIZE=1000 #units or kB, so this means 1 Meg
$FILESIZE=500000 #512 Meg
#$FILESIZE=1000000 #units or kB, so this means 1 Gig
$FILECOUNT=2 #creates a count of FILECOUNT of trace files at most of size FILESIZE
$TSHARK_LOCATION_REMOTE="c:\progra~1\wireshark\tshark"
$TSHARK_LOCATION_LOCAL="c:\progra~1\wireshark\tshark"
$TRACECMD_REMOTE="$TSHARK_LOCATION_REMOTE -b filesize:$FILESIZE -b files:$FILECOUNT -w $c -i $b"
$TRACECMD_LOCAL="$TSHARK_LOCATION_REMOTE -b filesize:$FILESIZE -b files:$FILECOUNT -w $c -i $a"
#
# Set up script block in order to evaluate parameters for remote command
# We use an interim file for asynchronously running the local trace
#
$sb_remote = {
param ($p1,$p2,$p3,$p4,$p5,$p6)
winrs /r:$p1 /u:$p2 /p:$p3 $p4
}
$TRACECMD_LOCAL > ./local_trace.ps1
#
# Start trace on remote host, then on local host
#
Write-Verbose "Starting remote trace with ${TRACECMD_REMOTE}"
Write-Verbose "(winrs /r:$r /u:$u /p:$p $TRACECMD_REMOTE)"
Start-Job -Scriptblock $sb_remote -ArgumentList $r,$u,$p,$TRACECMD_REMOTE
Write-Verbose "Starting local trace with ${TRACECMD_LOCAL}"
Start-Process powershell.exe -ArgumentList "-file ./local_trace.ps1"
#
# Monitor log file
#
#
Write-Verbose "Start of monitoring file $l ever $s seconds for string $t..."
#init counters
Select-string -path "$l" -pattern $t | Measure-object -line | ft -hidetableheaders > x.x ; $old_count = cat x.x | where {$_ -ne ""} | %{$_ -replace '\s+','' }
$new_count=$old_count
#loop until match found
$i=0
while ($new_count -eq $old_count) {
$i++
write-verbose "Iteration: $i, sleeping $s seconds..."
start-sleep -s $s
Write-verbose "Searching $l for $t..."
Select-string -path "$l" -pattern $t | Measure-object -line | ft -hidetableheaders > x.x ; $new_count = cat x.x | where {$_ -ne ""} | %{$_ -replace '\s+','' }
}
#
# At this point, search string has been found, stop traces
#
#remote
taskkill /f /s $r /u $u /p $p /fi "imagename eq tshark*"
#local
taskkill /f /fi "imagename eq tshark*"
Write-Verbose "Traces completed after $i iterations. Examine the set of $FILECOUNT files on each endpoint with file name: $l on both endpoints."
#
# Clean up
#
if (Test-Path "./x.x") { rm "./x.x" }
if (Test-Path "./local_trace.ps1") { rm ./local_trace.ps1 }
exit
Synchronized Windows to Linux Packet Capture
July 5th, 2017 | Garland Joseph
This script is part of a series of scripts that perform packet capture between two endpoints. In this case, the endpoints are a Unix machine and a windows machine. This script was tested with the “source endpoint” as a Redhat Linux and the “target endpoint” a Windows 2016 Server machine.
The circular traces are started on each machine and stopped whenever an event is detected on the Unix side. In this case the event is to monitor a file (i.e., log) for a particular string.
Requirements: Wireshark installed on Windows. OpenSSH installed on Windows.
Scenario

Script
#Author: Garland R. Joseph, garland.joseph@gmail.com
# Date: May 2017
# u2wcap: See usage below. "Unix to Windows Capture"
#
# This script is offered as is. It is designed to
# run a circular trace using tcpdump on UNIX system
# and wireshark on Windows systems.
#
# You will either have to manually enter the password
# for the root account on the remote system or setup
# ssh keys from promptless access.
#
# The traces will stop once a key string SEARCH_STRING is
# found in LOG_FILE.
#
# Note: Some UNIX systems like LINUX Fedora will
# result in permsission denied when using
# tcpdump -W and -C options and writing to / or /root.
#
# Modify the REM_INTERFACE parameter below to fix the interface number
# on the windows system. Do a tshark -D to determine the interface number.
#
#
# -----

#
# Defaults
#

USAGE="u2wcap [-v] [ -c capture_file ] [ -w secs ] -h remote_host -l log_file -s search_string"
DEBUG=false
SLEEP_TIME="5" #seconds
LOCAL_CAPTURE_FILE="/tmp/capture"
TCPDUMPCMD="tcpdump -C 1 -W 2 -w ${LOCAL_CAPTURE_FILE}"

#
# Options for remote tracing
#

REM_CAP_FILE="capture.windows"
REM_USER="wireshark"
REM_INTERFACE="4"
FILESIZE=1000 #units or kB, so this means 1 Meg
#FILESIZE=500000 #512 Meg
#$FILESIZE=1000000 #units or kB, so this means 1 Gig
FILECOUNT="2" #creates a count of FILECOUNT of trace files at most of size FILESIZE
TSHARK_LOCATION="c:\progra~1\wireshark\tshark"
#TRACECMD="$TSHARK_LOCATION -b filesize:$FILESIZE -b files:$FILECOUNT -w ${REM_CAP_FILE}"
TRACECMD="$TSHARK_LOCATION -b filesize:$FILESIZE -b files:$FILECOUNT -w ${REM_CAP_FILE} -i ${REM_INTERFACE}"


#
# Process command line arguments
#

while getopts ":vc:w:l:s:h:" opts
do
case ${opts} in
v) DEBUG=true ;;
c) CAPTURE_FILE=${OPTARG} ;;
w) SLEEP_TIME=${OPTARG} ;;
s) SEARCH_STRING=${OPTARG} ;;
l) LOG_FILE=${OPTARG} ;;
h) REMOTE_HOST=${OPTARG} ;;
":") echo "Please specify a value for ${OPTARG}" ; exit ;;
\?) echo "${OPTARG} is not a valid switch" ; echo "${USAGE}" ; exit;;
esac
done

#
# Insure required values have been specified, check for existence of
# log file, getops should handle case of no values for -l and -s.
# A sanity check in the event getopts varies per unix
#

if [[ -z ${SEARCH_STRING} || -z ${LOG_FILE} || -z ${REMOTE_HOST} ]]
then
echo ${USAGE}
exit
fi
if ! [[ -f ${LOG_FILE} ]]
then
echo "File ${LOG_FILE} does not exist"
exit
fi

#
# Start trace on remote host
#
$(ssh ${REM_USER}@${REMOTE_HOST} ${TRACECMD})& 2>&1 > /dev/null

#
# Start trace on this host
#

${TCPDUMPCMD} 2>/dev/null 1>/dev/null & LOCAL_PID=$!
${DEBUG} && echo "${0}-I-LOCAL_PID, local pid is ${LOCAL_PID}."

#
# Monitor log file
#

old_count=`grep -c ${SEARCH_STRING} ${LOG_FILE}`
(( new_count=old_count ))
(( i = 0 ))
while (( old_count == new_count ))
do
(( i++ ))
${DEBUG} && echo "${0}-F-SLEEP, sleeping ${SLEEP_TIME}, iternation ${i}."
sleep ${SLEEP_TIME}
new_count=`grep -c ${SEARCH_STRING} ${LOG_FILE}`
done

#
# At this point, search string has been found, stop traces
#

kill ${LOCAL_PID}
ssh ${REM_USER}@${REMOTE_HOST} taskkill /f /fi \"imagename eq tshark*\"

#
# Reminders
#

echo "Consult files ${REM_CAP_FILE} on remote host ${REMOTE_HOST} and ${LOC_CAP_FILE} on local host."

exit
Sizing Formula for Packet Capture Flow through an Out of Band Fabric
Caveat: This documentation is part of a larger set of proprietary information I created for a fortune 1000 company. This information is not confidential.
Problem
Non-networking groups are not familiar with show to size packet capture or “streaming capture” devices. Sizing these devices is mathematically a linear system of constraints.
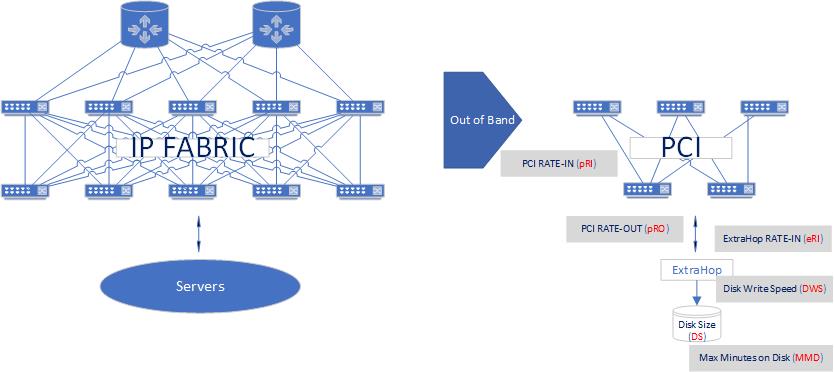
The following set of governing equations were developed for a security team to allow them to correctly size ExtraHop appliances attached to an out-of-band fabric (in turn, attached to the production IP fabric).
Theoretical
pRI = pRO = 10Gbps or 100Gbps
Equations
MMD = DS/eRI = DS x 1 / eRISimple Example: Caculating minutes of data on disk
A 100GBdisk, eRI=10Gbps(=758GB/m)
10 Gbps x 60s/m = 600 Gbpm
600 Gbpm x 1GB/8Gb = 75GB/m
MMD = 100GB / 75GB/M = 1.33 minutes
SSL Relationships in Network Telemetry
Garland R. Joseph, 3/1/2021